
Make graphs and data-driven art
This guide shows how to draw a graph from a table of numbers, change its type and options, and draw its columns and markers with your own art. It then covers the Variables panel, which binds text, images, graphs and visibility to variables so that one document can hold many versions of a design, one for each row of data.
Draw a graph
Section titled “Draw a graph”VectorCraft has nine graph tools. They share one group in the Tools panel. The default toolbar does not show them: choose Window → Toolbars → Advanced to show every tool, or press J to choose the Column Graph tool.
| Tool | Key | What it draws |
|---|---|---|
| Column Graph | J | Vertical columns, one cluster for each category |
| Stacked Column Graph | Columns with each series stacked on the one before it | |
| Bar Graph | Horizontal bars | |
| Stacked Bar Graph | Horizontal bars with the series stacked | |
| Line Graph | Points joined by lines, one line for each series | |
| Area Graph | Lines with the area below them filled | |
| Scatter Graph | Points placed by an x value and a y value | |
| Pie Graph | A circle divided into wedges | |
| Radar Graph | Values on spokes around a center |
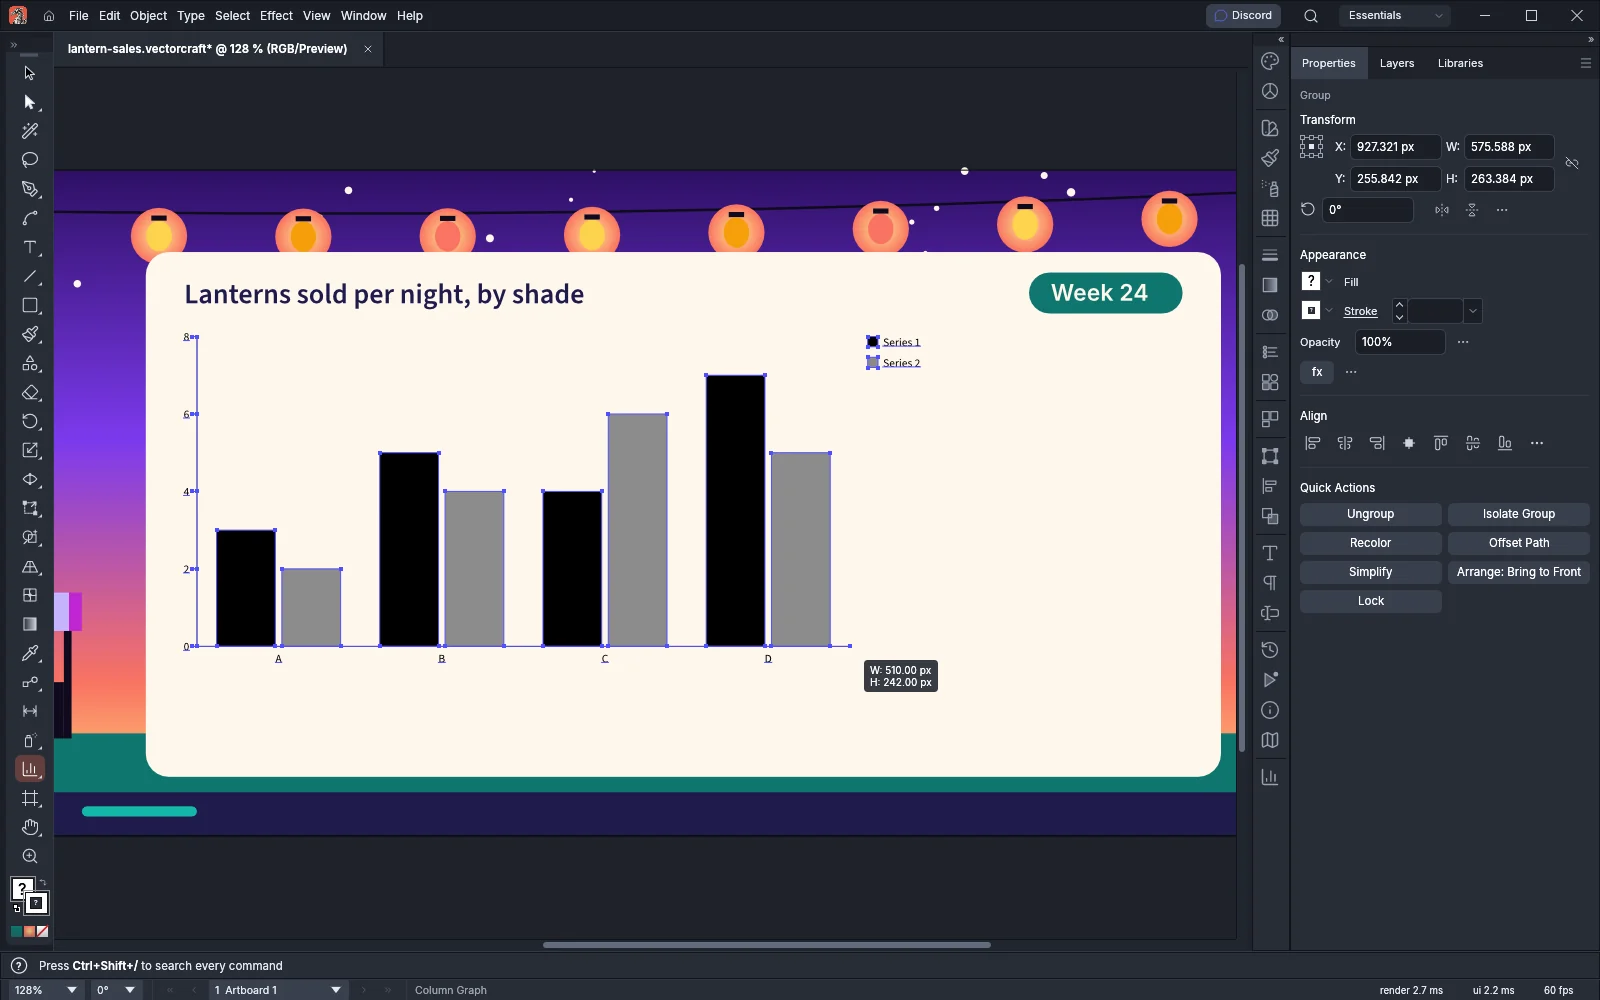
- Choose a graph tool.
- Drag on the canvas to draw the rectangle the graph fills. Hold Shift to make it square, or hold Alt (Option on macOS) to draw it out from the center. To type the size instead, click once: the Graph dialog opens with a Width of 200 and a Height of 150.
- When you release the mouse button, the Graph Data window opens. Enter your data as the next section describes. A graph made with the Graph dialog opens without it: choose Object → Graph → Data… to enter its data.
A new graph starts with sample data, two series over four categories. VectorCraft draws the graph as a group named after its type, for example Column Graph. Double-click a graph tool in the Tools panel to open Graph Type for the selected graph.
Enter and import graph data
Section titled “Enter and import graph data”Select a graph and choose Object → Graph → Data… to open the Graph Data window. The window shows the graph’s data as a sheet:
- The first row holds the series names, which the legend shows.
- The first column holds the category names, which label the columns or points.
- The top-left cell stays blank, and every other cell holds a value.
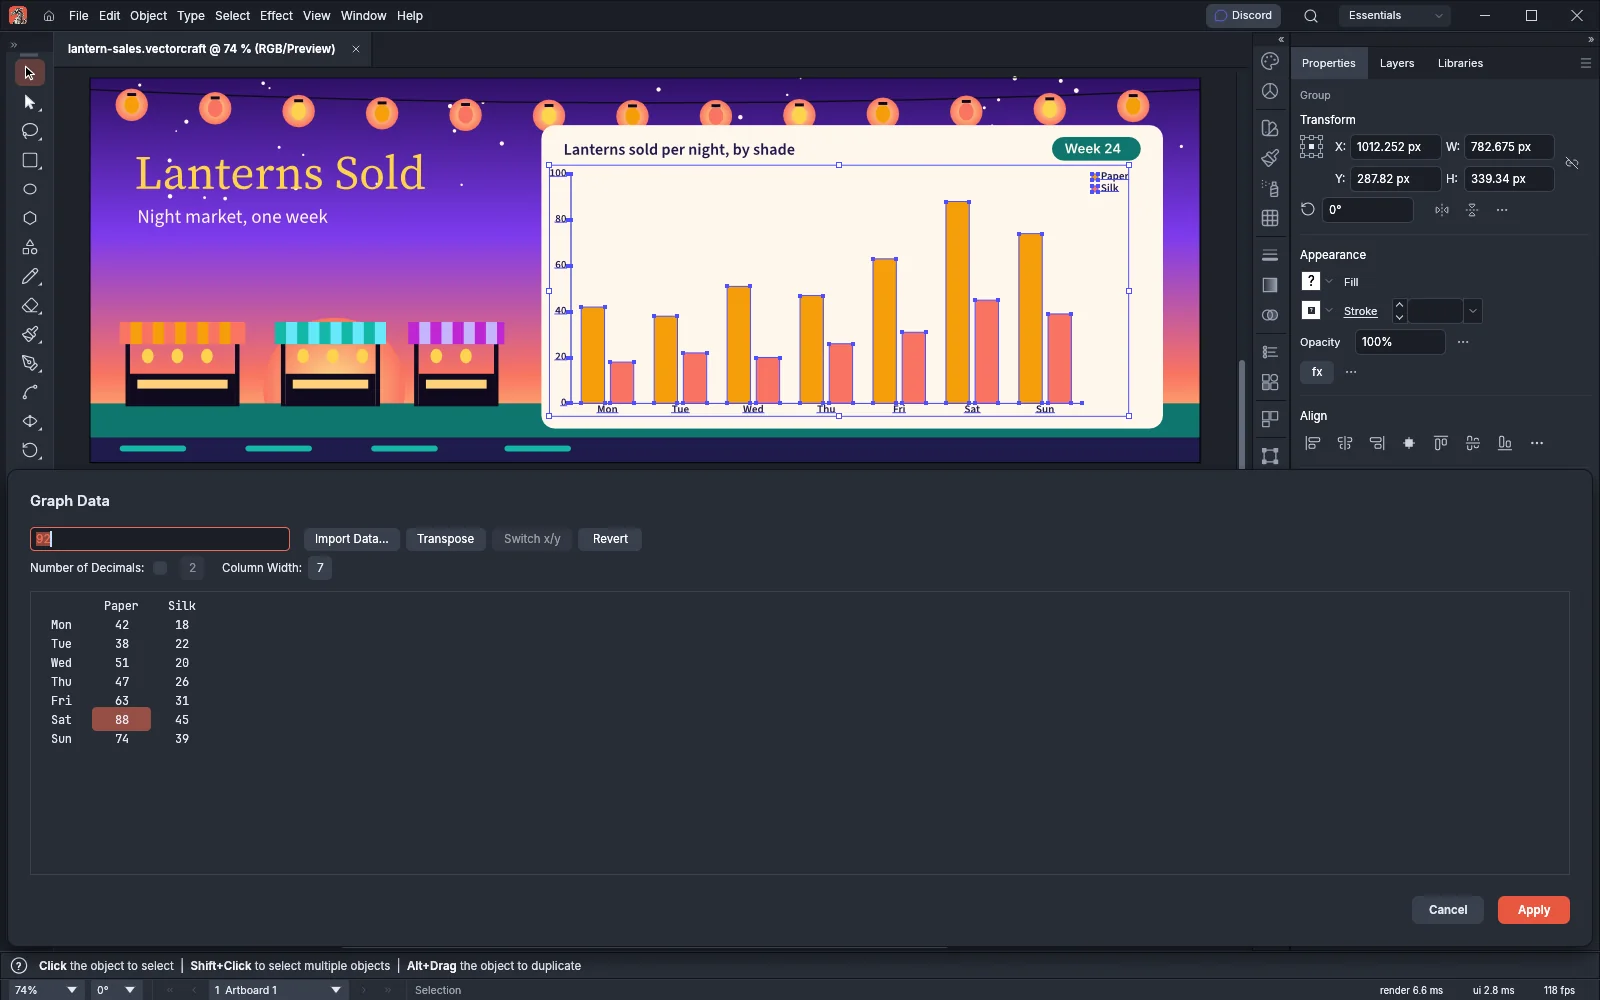
- Click a cell to pick it. Its value appears in the entry box above the sheet.
- Type the new value in the entry box. Press Tab to enter it and move to the next cell in the row, or Enter to move to the next cell in the column. Hold Shift with Tab or Enter to move the other way. The arrow keys also move between cells.
- Click Apply to redraw the graph. The window stays open, so you can keep editing. Click Cancel to close it.
To fill many cells at once, pick the first cell and paste text copied from a spreadsheet. Tabs and line breaks in the text start new cells and new rows.
A blank cell has no value. To use a number as a label, for example a year as a category name, type it in straight quotes (“2026”). A | in a label starts a new line in that label.
| Control | What it does |
|---|---|
| Import Data… | Replaces the sheet with a text file (.txt, .tsv or .csv). VectorCraft separates cells at tabs when the file has any, and at commas when it has none. Files can be UTF-8 or UTF-16 with a byte-order mark |
| Transpose | Swaps rows and columns, so the categories become series |
| Switch x/y | Swaps the x and y columns of each series in a scatter graph. It is unavailable for other graph types |
| Revert | Reads the graph’s data again and discards the edits you have not applied |
| Number of Decimals | Select the check box to show every value with the same number of decimal places, from 0 to 10 |
| Column Width | Sets how wide the sheet’s columns are, in digits, from 0 to 20. The default is 7 |
A graph can hold up to 10,000 categories and 256 series.
Change the graph type and its options
Section titled “Change the graph type and its options”Select a graph and choose Object → Graph → Type…. The Graph Type dialog lists the options for the graph’s type. Change them and click OK.
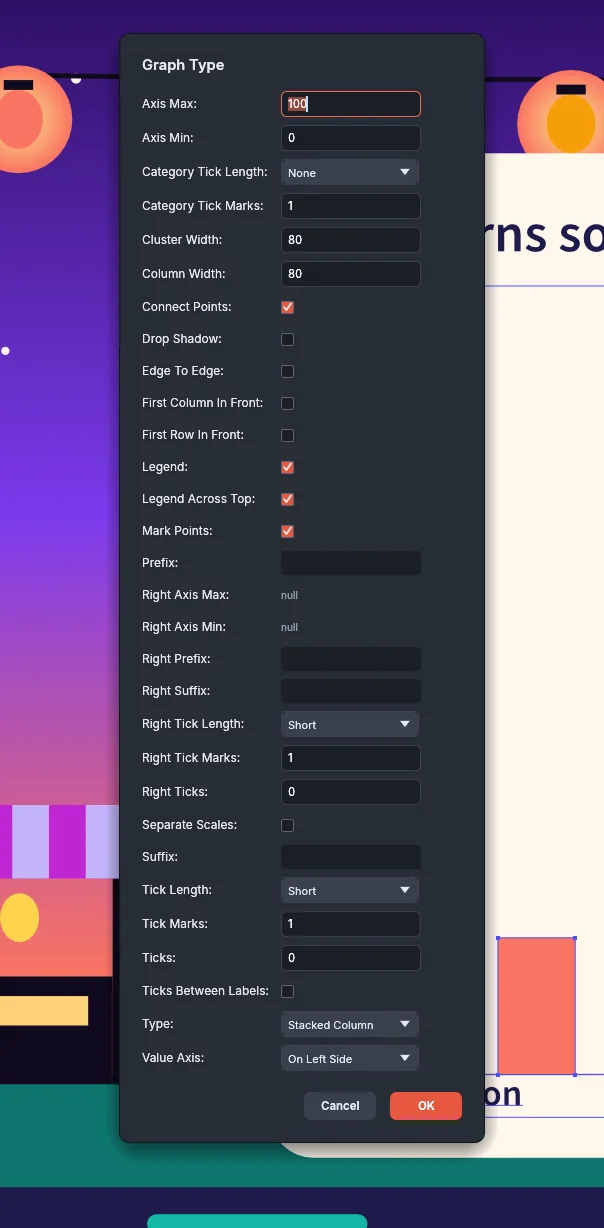
| Option | What it does | Default |
|---|---|---|
| Type | Changes the graph to one of the nine types | The tool you drew with |
| Value Axis | Puts the value axis On Left Side, On Right Side or On Both Sides. Bar graphs keep it along the bottom | On Left Side |
| Column Width | The width of each column or bar, as a percentage of the space it has. Values above 100 make the columns overlap | 90 |
| Cluster Width | The width of each category’s group of columns, as a percentage of the space it has | 80 |
| Legend | Shows the legend | On |
| Legend Across Top | Puts the legend in rows above the graph | Off |
| Drop Shadow | Adds a dark shadow below and to the right of the columns, bars, lines and wedges | Off |
| First Row In Front, First Column In Front | Chooses which overlapping columns or bars are drawn on top | Off |
| Mark Points, Connect Points | Draws a marker at each data point, and lines between the points, in line, scatter and radar graphs | On |
| Edge To Edge | Runs the lines of a line graph across the whole width of the graph | Off |
| Ticks | The number of divisions on the value axis. 0 calculates them from the data | 0 |
| Axis Min, Axis Max | Set together, they fix the value axis to that range, in Ticks divisions (5 when Ticks is 0). A graph without a fixed range shows null in both rows and calculates the range from the data | Not set |
| Tick Length, Tick Marks | The length of the value-axis ticks (None, Short or Full Width) and the number of tick marks in each division | Short, 1 |
| Category Tick Length, Category Tick Marks | The same settings for the category axis | None, 1 |
| Ticks Between Labels | Puts the category ticks between the category labels | Off |
| Prefix, Suffix | Text shown before and after each number on the value axis, for example $ or % |
Empty |
| Separate Scales, Right Ticks, Right Axis Min, Right Axis Max | With the value axis on both sides, Separate Scales gives the series on the right axis their own scale, set with Right Ticks, Right Axis Min and Right Axis Max like the left one | Off, 0, Not set |
| Right Tick Length, Right Tick Marks, Right Prefix, Right Suffix | The tick and number settings for the right value axis | Short, 1, Empty, Empty |
The dialog has no box to type in while Axis Min and Axis Max show null. To fix the range of such a graph, run the graph.setType command on the graph with axisMin and axisMax. The command changes the graph that is selected, so select it first. Save the document and close it, then run vectorcraft-cli on its file, as Automate VectorCraft describes:
vectorcraft-cli run --in lantern-sales.vectorcraft --cmd select.all --cmd graph.setType --params '{"axisMin":0,"axisMax":100}' --export lantern-sales.vectorcraftselect.all selects the graph, and --export saves the result back to the .vectorcraft file. Open the file again in VectorCraft. To change a document that is open in VectorCraft instead, select the graph and run graph.setType from a Model Context Protocol (MCP) client connected to the app, as Drive VectorCraft from an MCP client describes.
Both rows then hold numbers that you can change in the dialog. To go back to a calculated range, run graph.setType with {"axisMin":null,"axisMax":null}. Right Axis Min and Right Axis Max work the same way with rightAxisMin and rightAxisMax.
In a pie graph, three pie options replace Legend. Pie Legend chooses No Legend, Standard Legend or Legends in Wedges. Pie Position sizes several pies by their totals (Ratio), at one size (Even) or stacked one on another (Stacked). Pie Sort orders the wedges largest first in each pie (All), in the first pie’s order (First) or in data order (None). Line, scatter and radar graphs also have Filled Lines, which draws each connecting line as a 3 pt band filled with the series color.
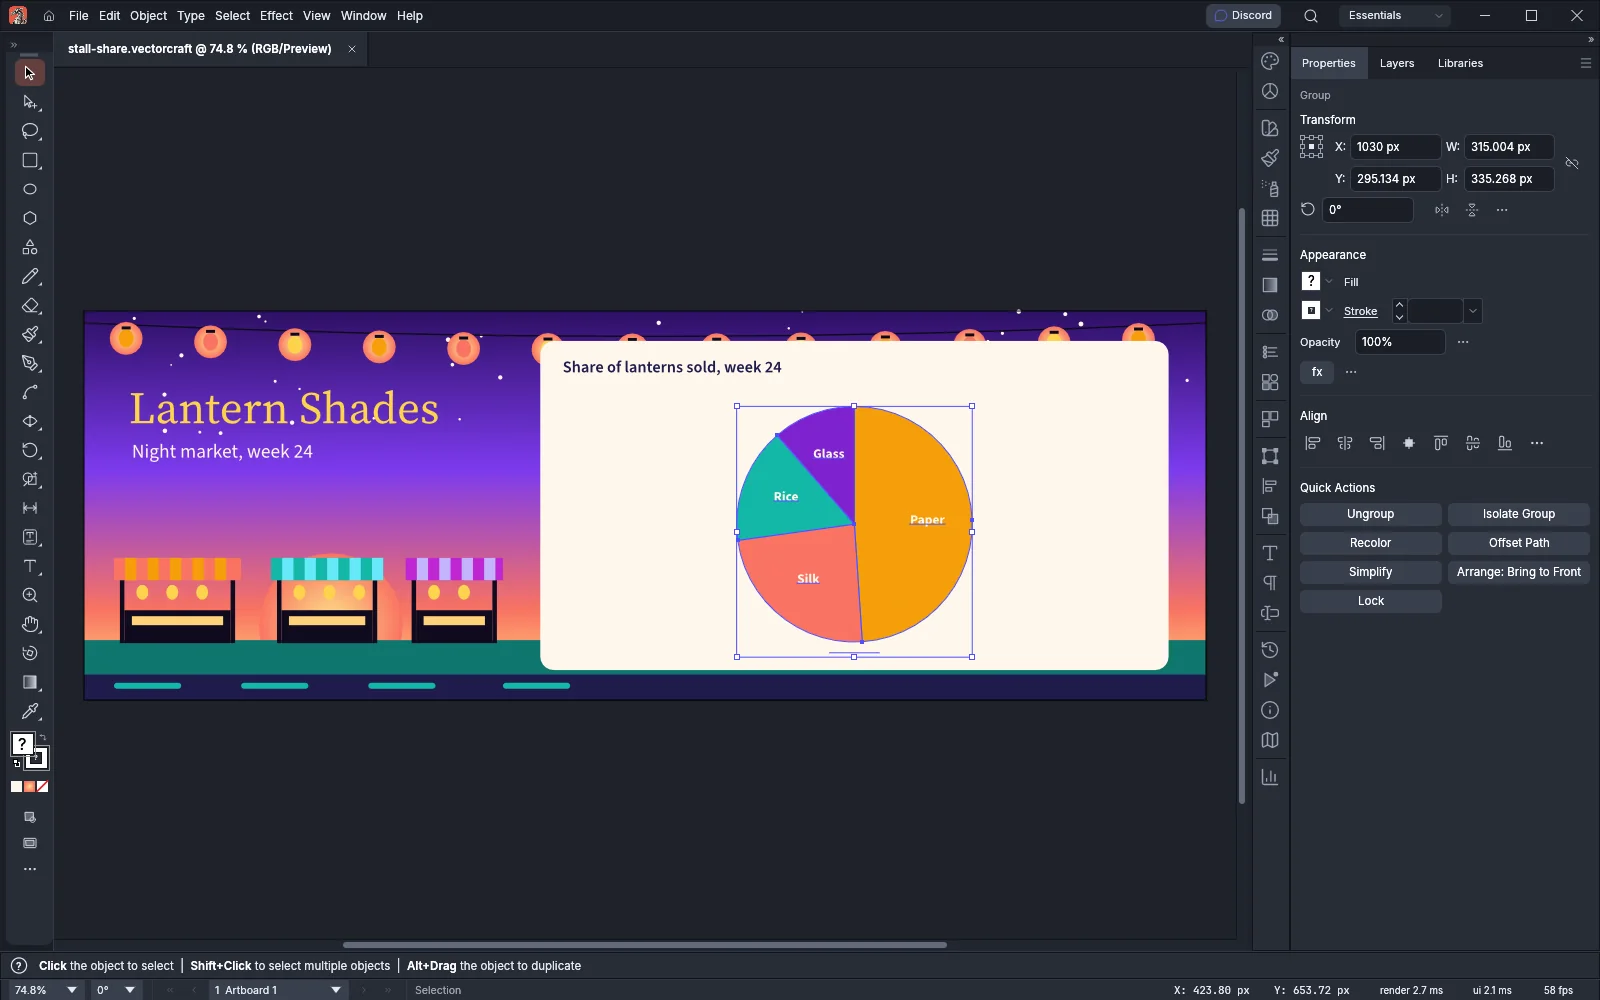
To change the color of a series, select one of its columns, bars or markers with the Group Selection tool and set its fill. The graph keeps that color when it is drawn again, for example after you apply new data. The same applies to the labels: a font, size or color change to all of a label’s text is kept.
To combine two graph types, for example columns with a line, select the series you want to change with the Group Selection tool, then choose Object → Graph → Type… and pick the type for those series. The Value Axis setting then puts those series on the left or right axis. Column, stacked column, line and area series can be mixed, and so can bar and stacked bar series.
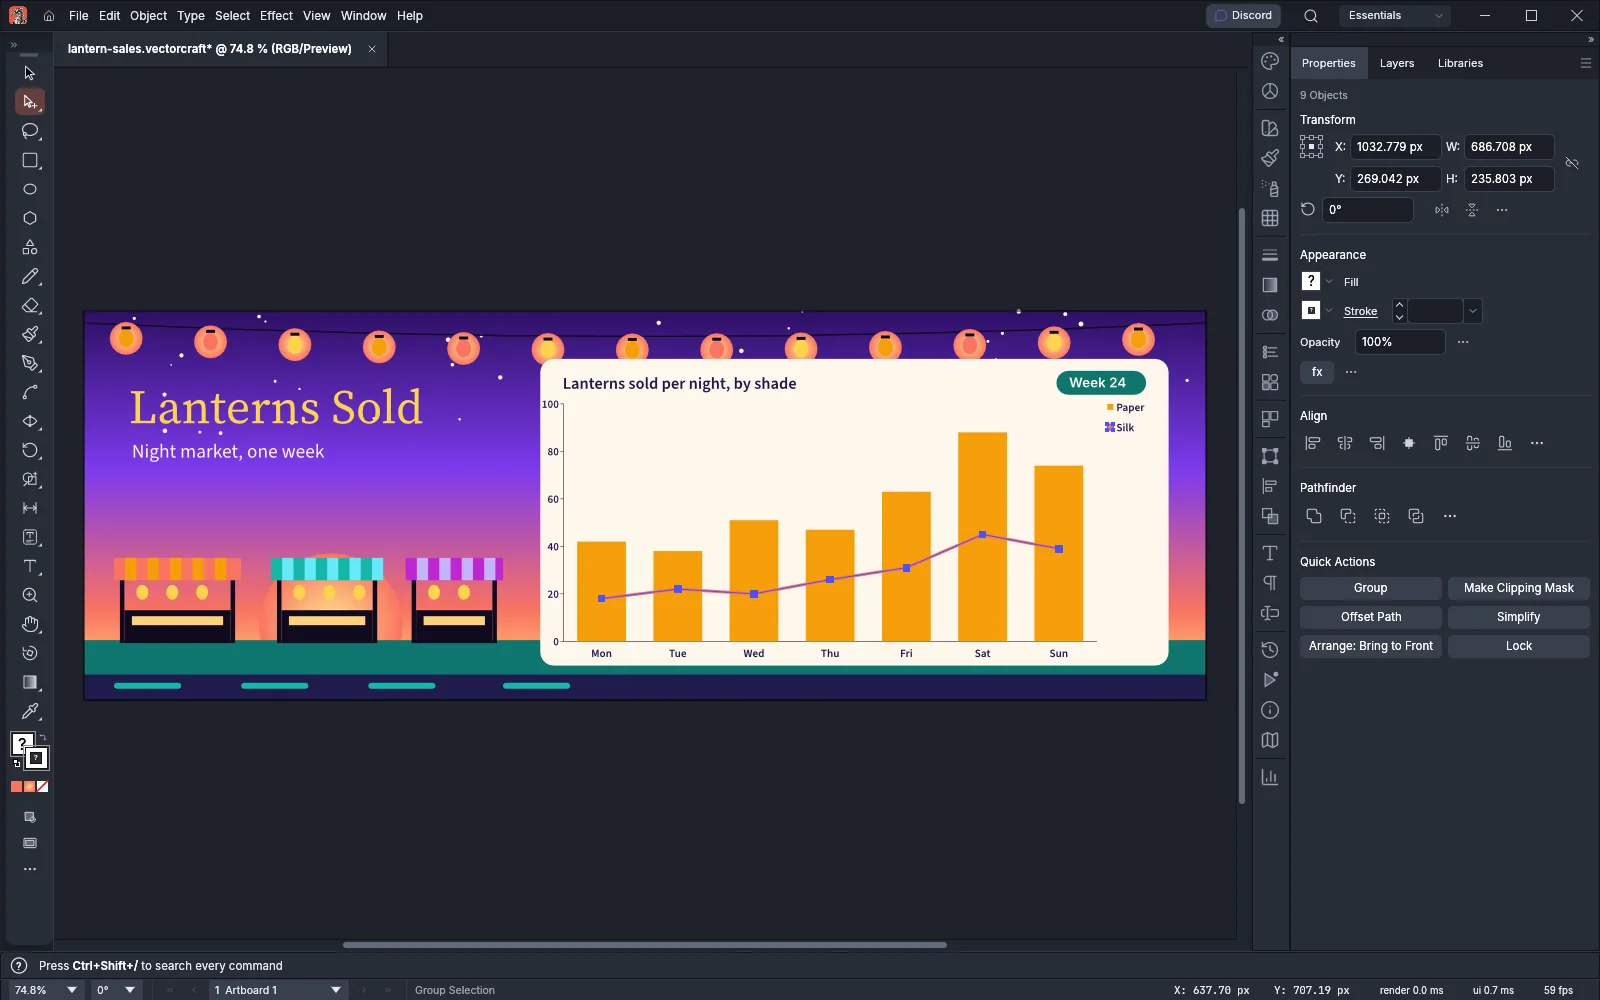
Use your own art for columns and markers
Section titled “Use your own art for columns and markers”A graph design is a piece of art that a graph draws in place of its plain columns or markers.
Make a design
Section titled “Make a design”- Draw the art. To set the area the design fills, put a rectangle behind the art. That backmost object becomes the design’s frame.
- Select the art and choose Object → Graph → Design….
- Click New Design. The design appears in the list as New Design.
- To rename it, type a name in Name and click Rename. Graphs that use the design keep using it.
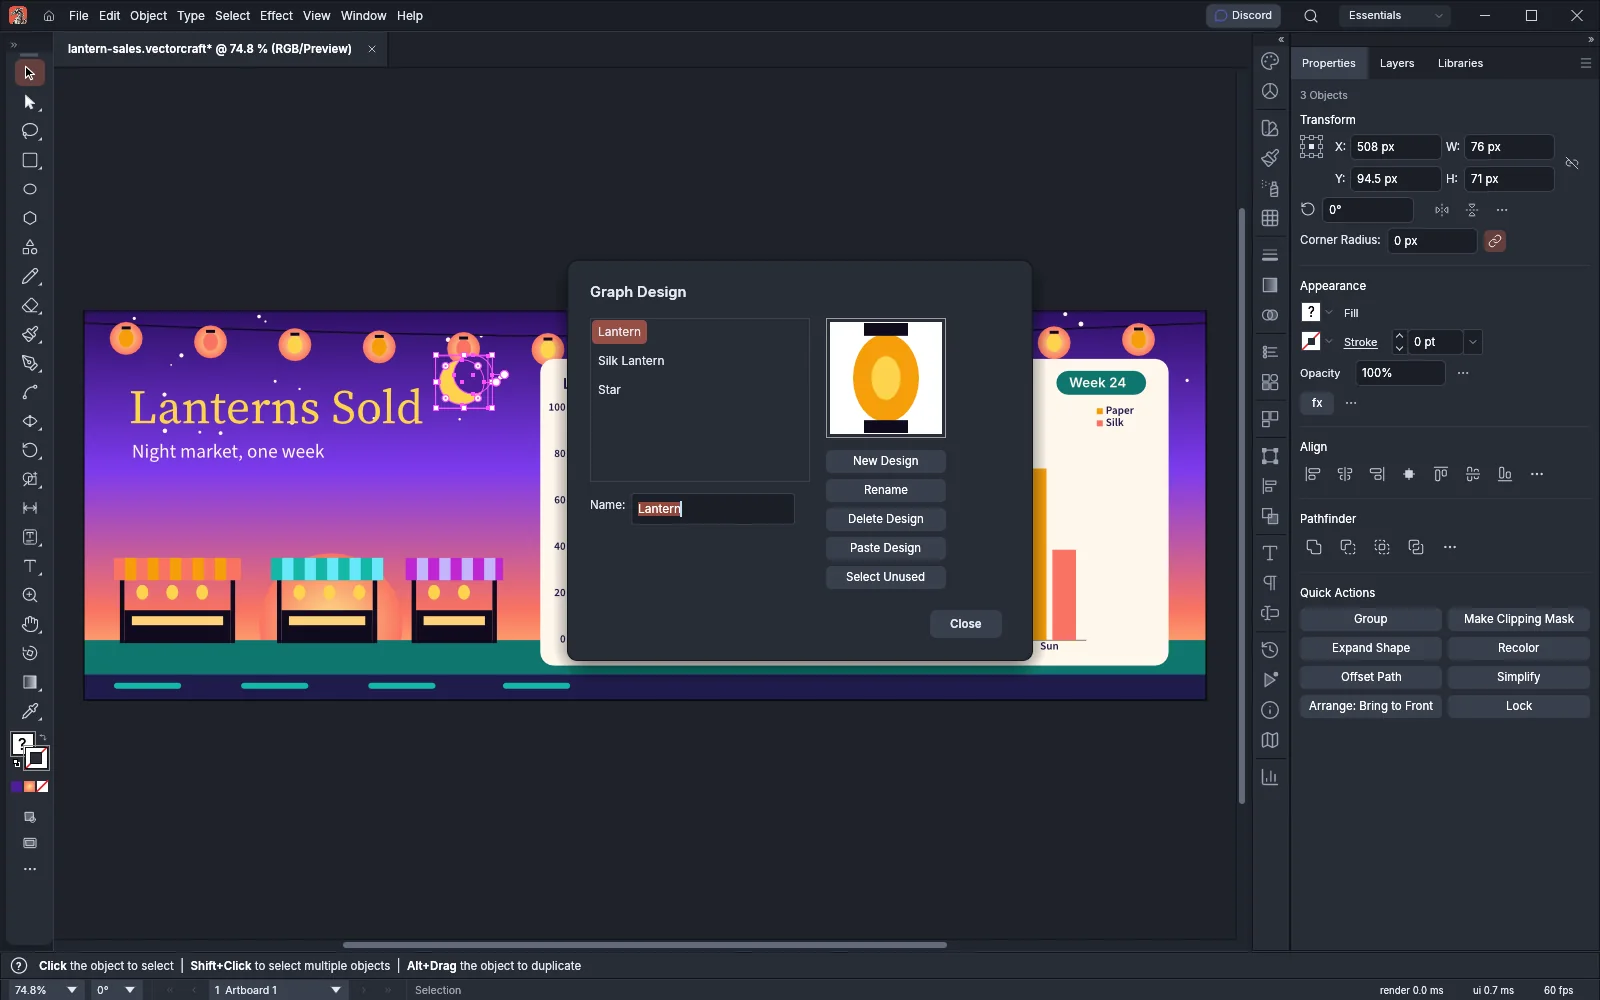
| Button | What it does |
|---|---|
| New Design | Makes the selected art a design |
| Rename | Gives the selected design the name typed in Name |
| Delete Design | Deletes the selected designs. Graphs that used them go back to their plain columns or markers |
| Paste Design | Puts a copy of the selected design’s art into the document, selected, so you can edit it and save it as a new design |
| Select Unused | Selects the designs that no graph uses |
Draw columns with a design
Section titled “Draw columns with a design”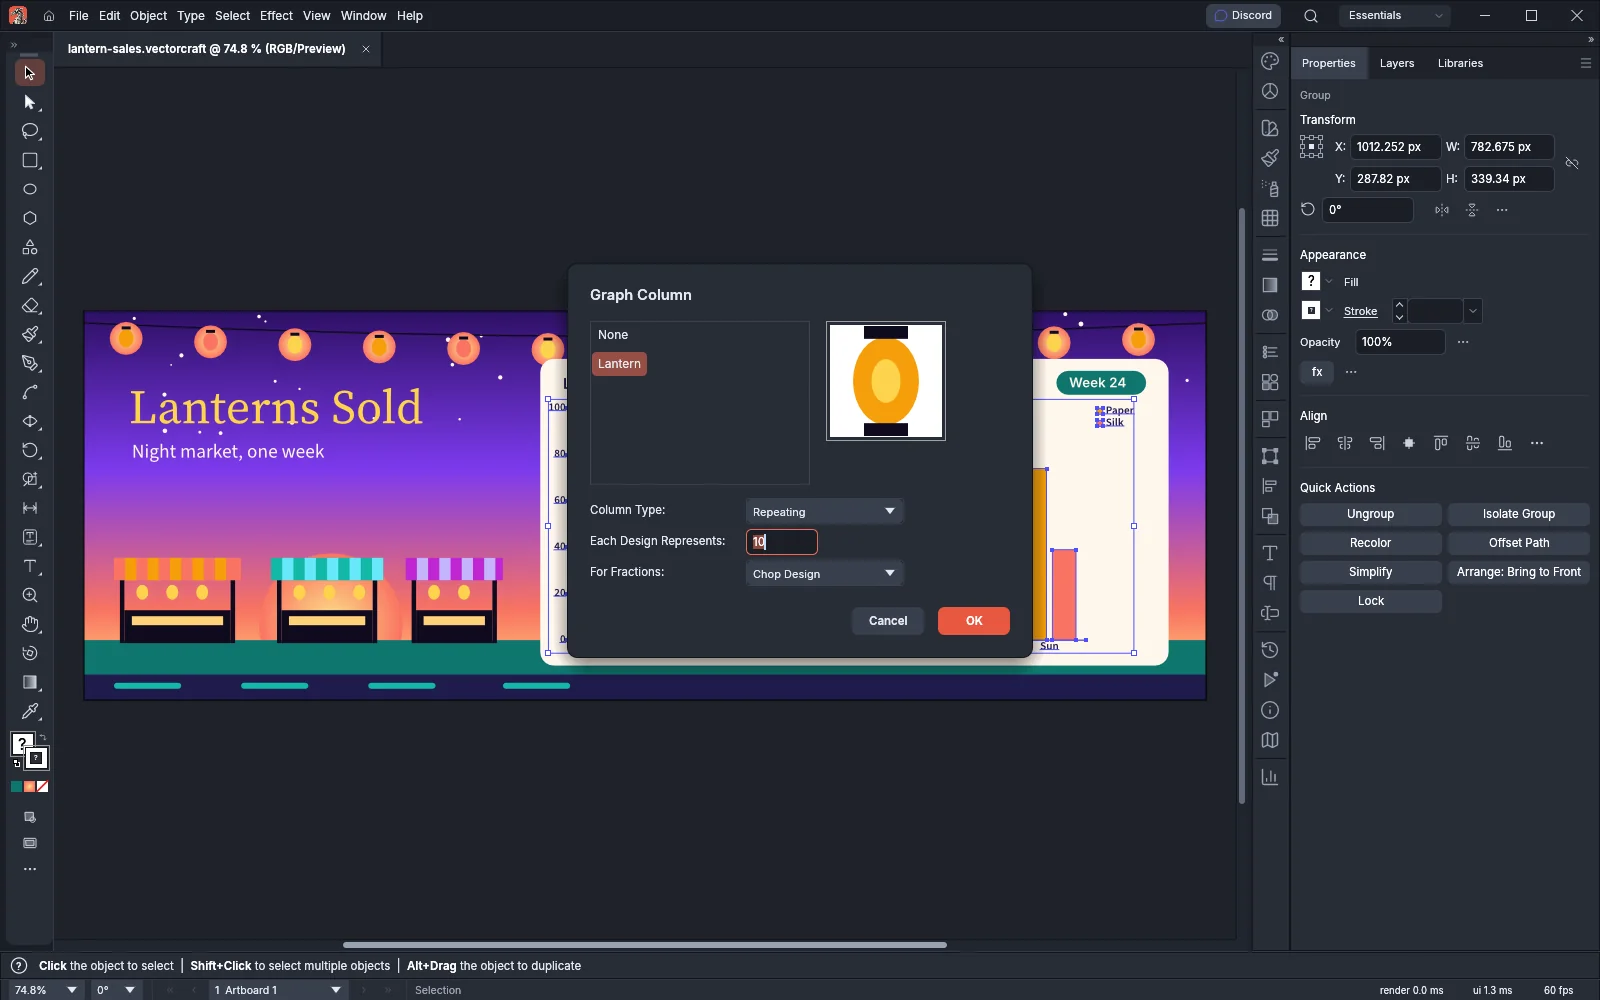
- Select the series to change with the Group Selection tool. To change every series, select the whole graph.
- Choose Object → Graph → Column…. This works on column, stacked column, bar and stacked bar graphs.
- Pick a design in the list, or None for plain columns. The box beside the list shows the picked design. Then choose a Column Type:
| Column Type | How the design is drawn |
|---|---|
| Vertically Scaled | Stretched along the value axis to each column’s length, at the column’s width. This is the default |
| Uniformly Scaled | Scaled in both directions to each column’s length, centered on the column |
| Repeating | Copies stacked out from the zero line. Each Design Represents sets the value of one copy (10 by default). For Fractions chooses Chop Design to cut the last copy where the value ends, or Scale Design to scale it down to fit. These two rows are available only for Repeating |
| Sliding | The part of the design above a horizontal guide line is scaled with the column’s width, and the part below it stretches to fill the rest. In a bar graph, use a vertical guide line |
- Click OK.
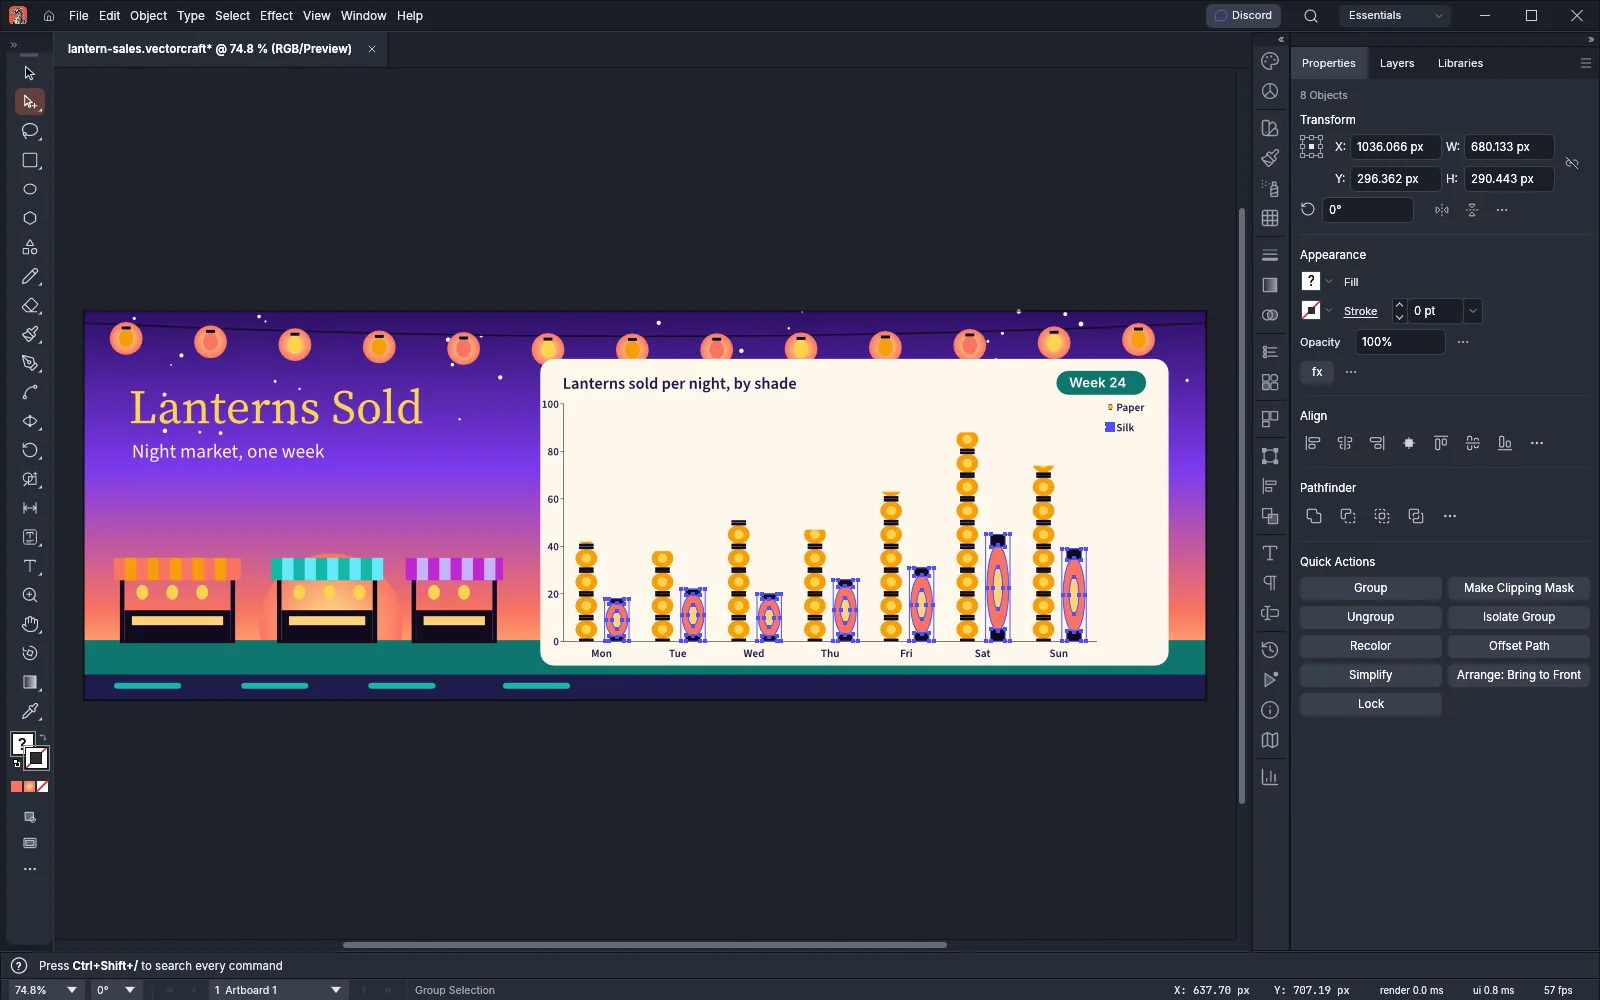
To show each column’s value in the design, add type to the design that holds % followed by two digits, for example %31. The first digit is the smallest number of places before the decimal point, and the second is the number of places after it. The graph replaces the % and the two digits with the value.
Draw markers with a design
Section titled “Draw markers with a design”- Select the series with the Group Selection tool, or select the whole graph.
- Choose Object → Graph → Marker…. This works on line, scatter and radar graphs.
- Pick a design, or None for the default square marker, and click OK. VectorCraft scales the design so that its backmost object fills the default marker’s square.
Bind objects to variables
Section titled “Bind objects to variables”A variable is a named value that VectorCraft puts into the objects bound to it. Each variable has one of four kinds:
| Kind | What it changes |
|---|---|
| Text | The text of a type object |
| Image | The file a placed image shows |
| Graph | The data of a graph |
| Visibility | Whether objects are shown or hidden |
Choose Window → Variables to open the Variables panel. The Data Set list is at the top, the Variables list in the middle shows each variable with the object bound to it, and the Data Sets list shows each data set with the number of values it holds.
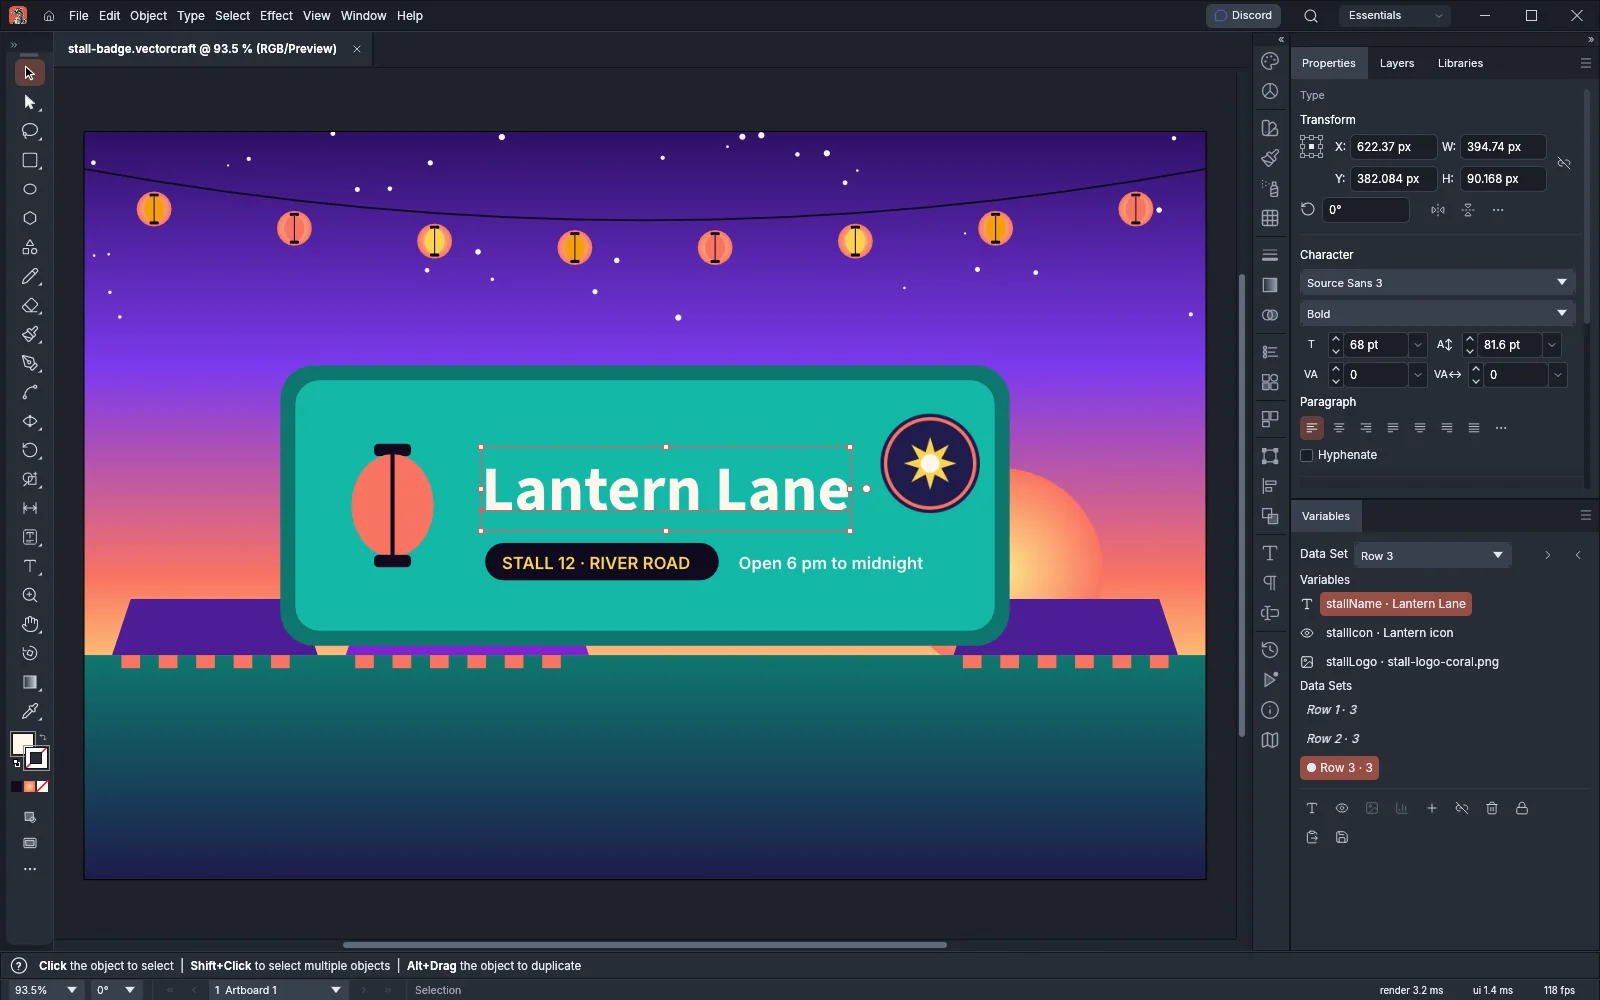
- Select the object to bind.
- Click the button for its kind in the panel’s bottom bar: Make Text Dynamic (one type object), Make Image Dynamic (one placed image), Make Graph Dynamic (graphs only) or Make Visibility Dynamic (any selection).
- VectorCraft defines a variable named after the object and binds the object to it. To rename the variable, double-click its row, or choose Variable Options… in the panel menu.
To define a variable that no object uses yet, click New Variable…, type a Name and choose its Kind.
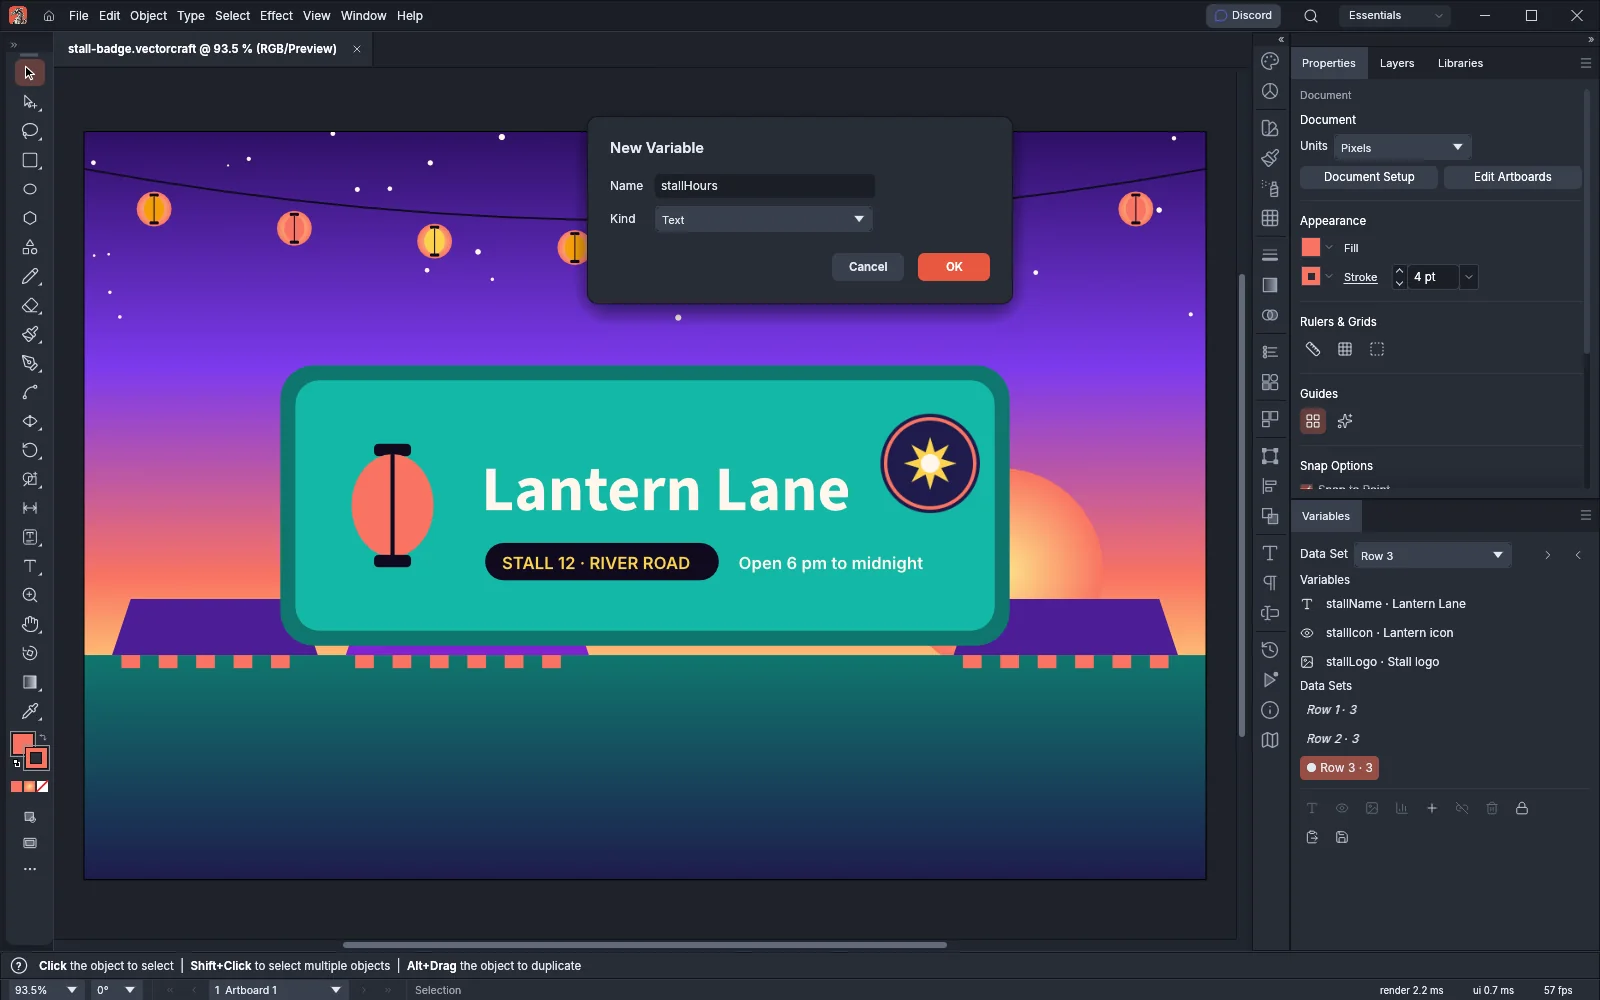
| Command | Where | What it does |
|---|---|---|
| Unbind Variable | Button and panel menu | Removes every variable from the selected objects. The variables stay in the list |
| Delete Variable | Button and panel menu | Deletes the highlighted variable with its bindings and its values in every data set |
| Lock Variables | Button and panel menu | Stops variables from being defined, deleted or renamed. While the variables are locked, the panel turns off New Variable…, Delete Variable, Variable Options…, Make Text Dynamic, Make Image Dynamic, Make Graph Dynamic and Make Visibility Dynamic, and Import Data Sets… does not import a file whose header names a new variable. Unbinding, capturing, updating and switching data sets still work. The lock is saved with the document. The button’s tooltip and the panel menu item then read Unlock Variables: click the button or choose that item to remove the lock |
| Select Bound Object | Panel menu | Selects the objects bound to the highlighted variable |
| Select All Bound Objects | Panel menu | Selects every object that has a variable |
Click a variable’s row to highlight it and select the objects bound to it.
Make one design per row of data
Section titled “Make one design per row of data”A data set is one row of values, one value for each variable. When you choose a data set, VectorCraft puts its values into the bound objects: the text changes, the image is relinked, the graph is redrawn and objects are shown or hidden.
Make data sets in the panel
Section titled “Make data sets in the panel”- Set up the art the way the first version should look.
- Click Capture Data Set. VectorCraft records what the bound objects hold now as a new data set, named Data Set 1, Data Set 2 and so on, and makes it the current one.
- Change the text, image, graph data or visibility for the next version, and click Capture Data Set again.
- To step through the data sets, use the arrows beside the Data Set list, choose a name from the list, or click a row in Data Sets. The arrows wrap around from the last data set to the first.
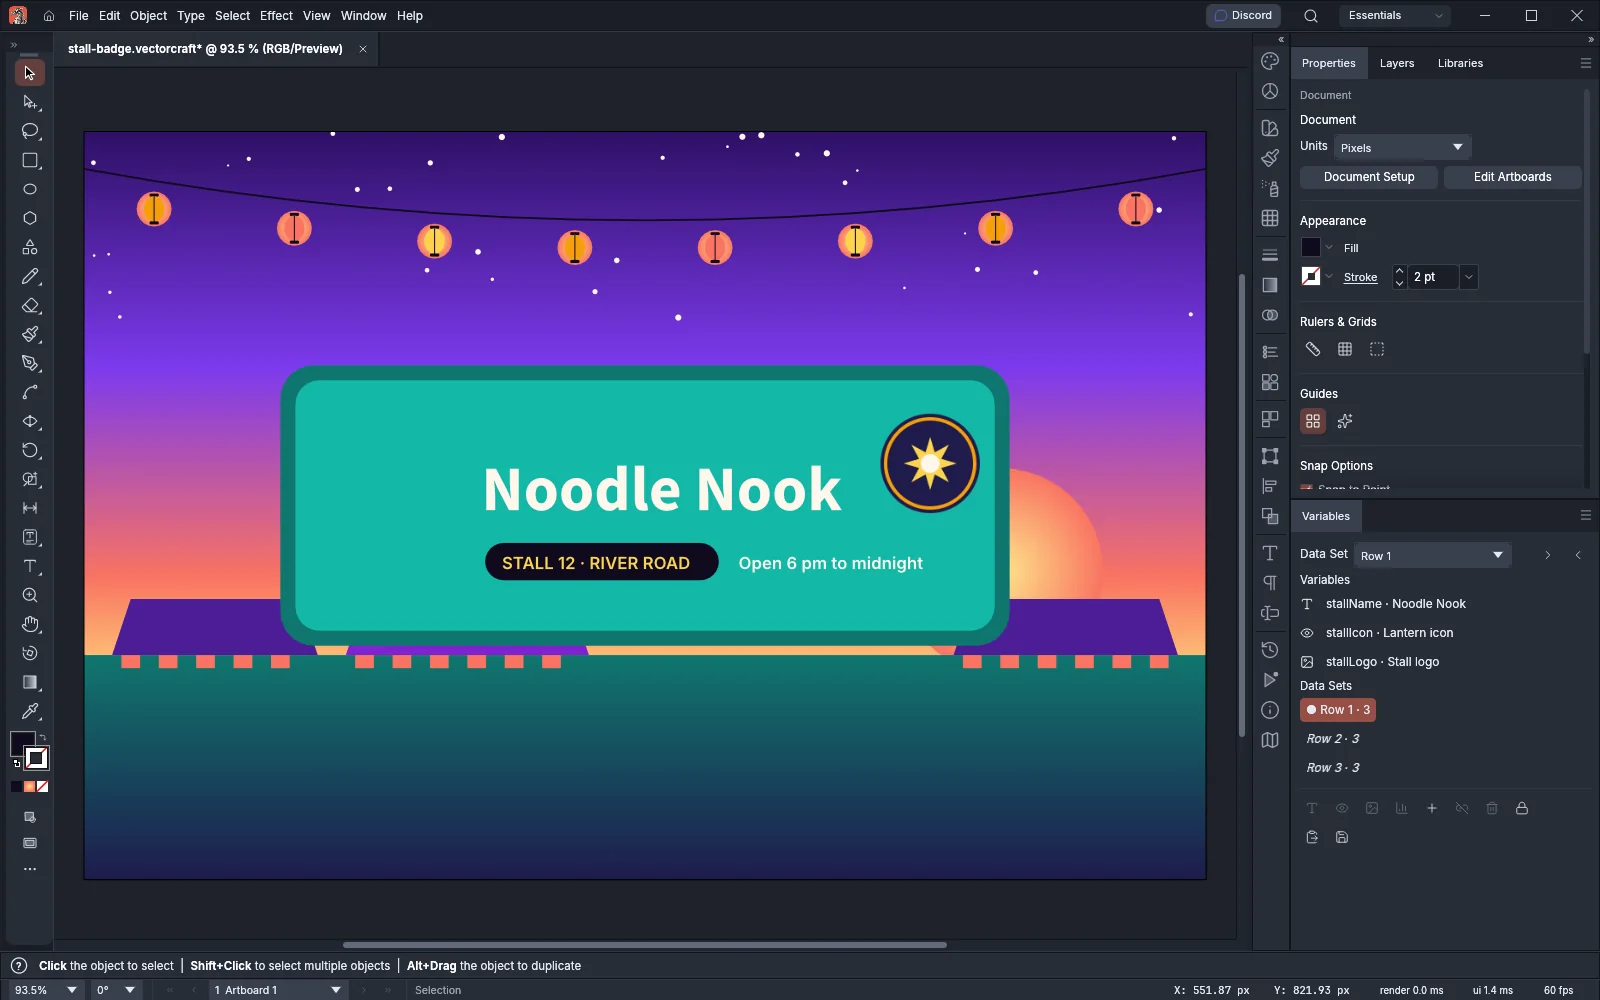
A data set name in italics holds values that differ from what the art shows now. To save your edits into the current data set, click Update Data Set. The panel menu also has New Data Set…, Edit Data Set…, Rename Data Set… and Delete Data Set, which deletes only the current data set.
Import and export data sets as CSV
Section titled “Import and export data sets as CSV”Choose Import Data Sets… in the panel menu and pick a comma- or tab-separated file (.csv, .tsv or .txt). The import replaces every data set in the document.
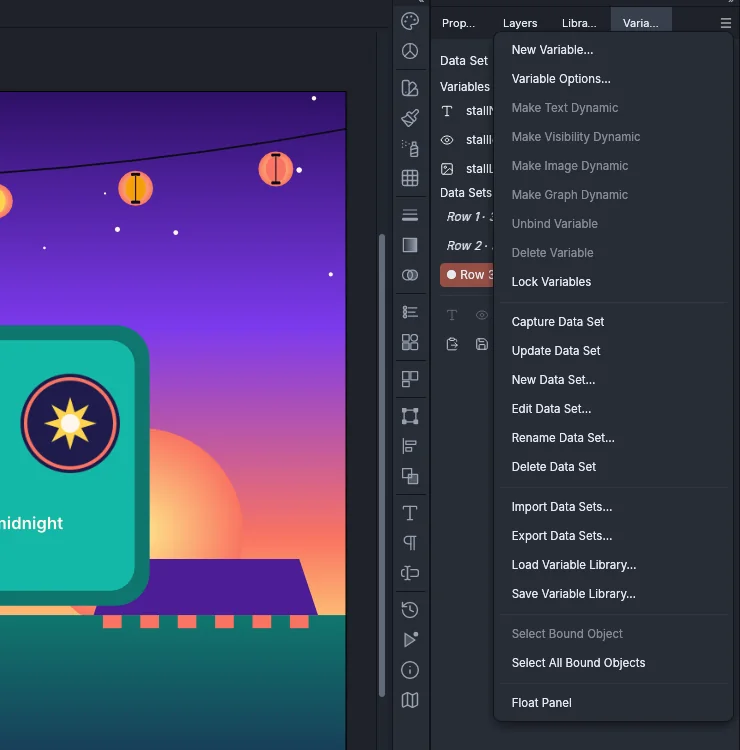
- The first row names one variable in each column. Upper and lower case do not matter.
- Each following row becomes a data set, named Data Set 1, Data Set 2 and so on in file order.
- A column name that is not a variable yet defines a new, unbound variable. Start the name with
#to make it a visibility variable, or with@to make it an image variable. A name without either character makes a text variable. - A visibility value is
trueorfalse. An image value is the path of the image file.
A file for the stall badge in the Variables panel image could look like this:
stallName,#stallIcon,@stallLogoNoodle Nook,false,C:/Art/night-market/logos/stall-logo-amber.pngTea Terrace,true,C:/Art/night-market/logos/stall-logo-teal.pngLantern Lane,true,C:/Art/night-market/logos/stall-logo-coral.pngExport Data Sets… writes every data set to a CSV file in the same layout, with # and @ in front of visibility and image variable names. It does not write the data set names. A document can export up to 1,000 data sets and 256 variables.
Save one file per data set
Section titled “Save one file per data set”To write every version to its own file, record an action, then play it once for each data set:
- In the Actions panel, record the steps that each version needs, for example an export. Automate VectorCraft covers recording.
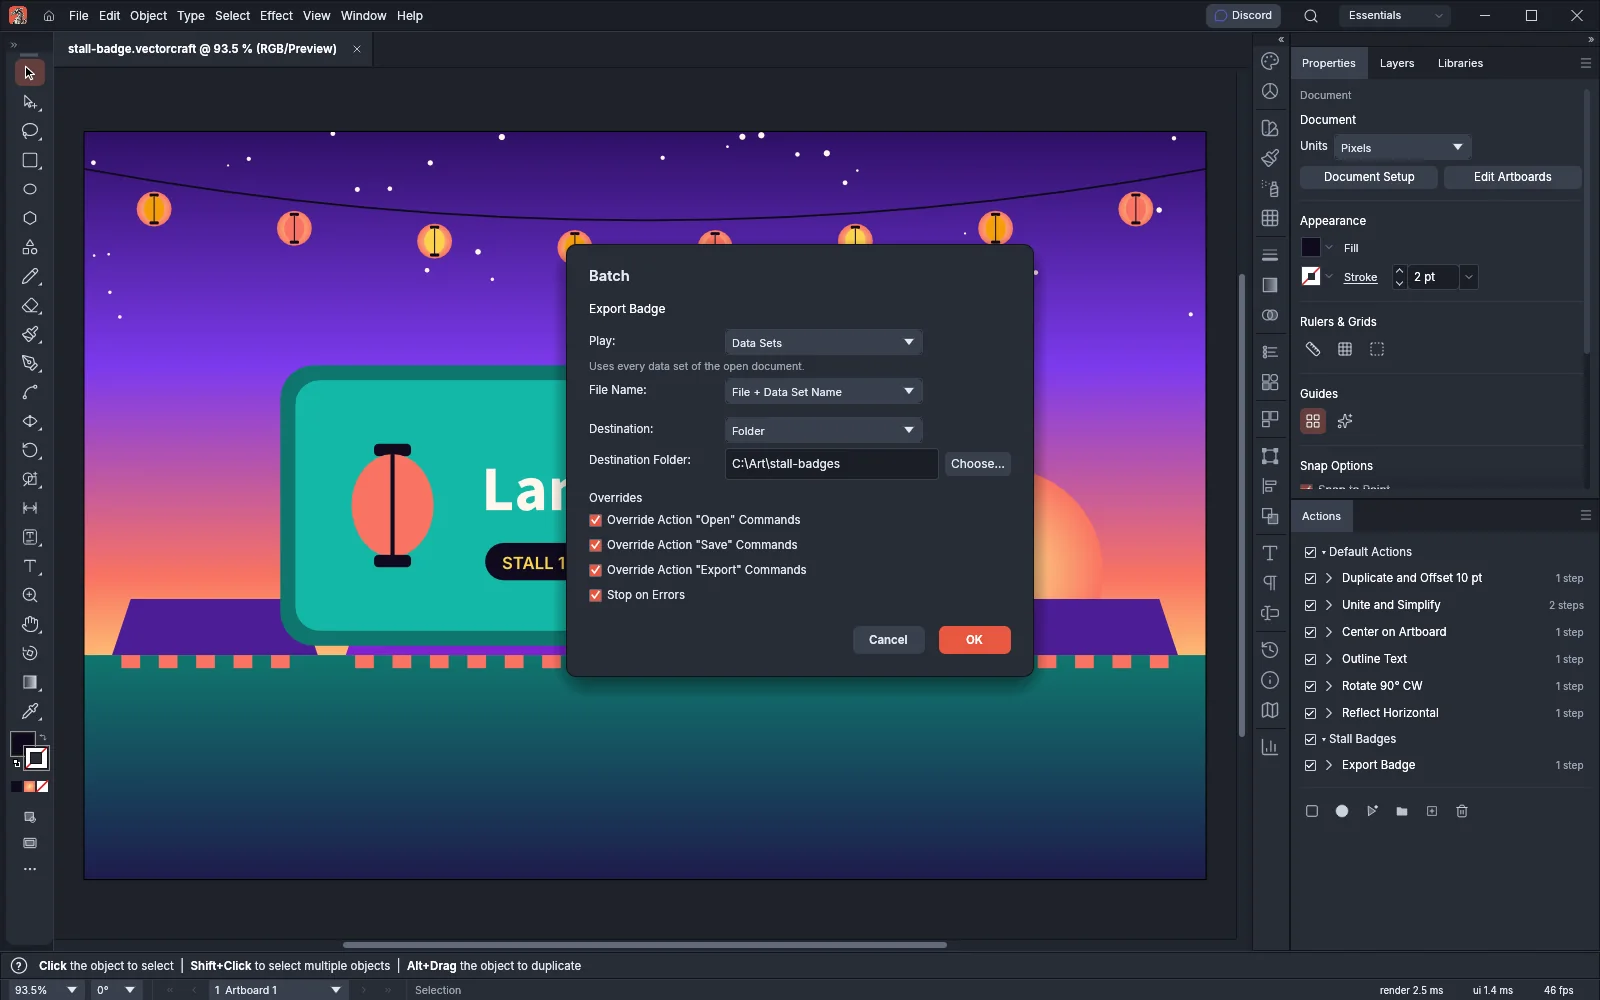
- Select the action and choose Batch… in the Actions panel menu.
- Set Play to Data Sets. The batch applies every data set of the open document in turn.
- Choose a File Name. File + Number names the files after the document with 001, 002 and so on added, File + Data Set Name adds the data set name to the document name, and Data Set Name uses the data set name alone.
- Set Destination to Folder, choose the Destination Folder and click OK. VectorCraft writes a copy for each data set and keeps the document open.
Save and load a variable library
Section titled “Save and load a variable library”A variable library is an XML file that holds a document’s text variables and its data sets, so that you can use them in another document.
- To save one, choose Save Variable Library… in the panel menu. The file holds the text variables and every data set’s values for them. Variables of other kinds are left out, and the command needs at least one text variable. Each variable name must start with a letter or
_and contain only letters, digits,-,_and.. - To load one, choose Load Variable Library… and pick the
.xmlfile. The library replaces the document’s variables and data sets. A text variable that the library also defines keeps its bindings. Every other variable is deleted with its bindings, and the library’s variables are added unbound. VectorCraft reads text variables only and lists the others it skipped.
While the variables are locked, Load Variable Library… does not load a library that would add or delete a variable.